

Excel 2016 offers Business Intelligence… built in
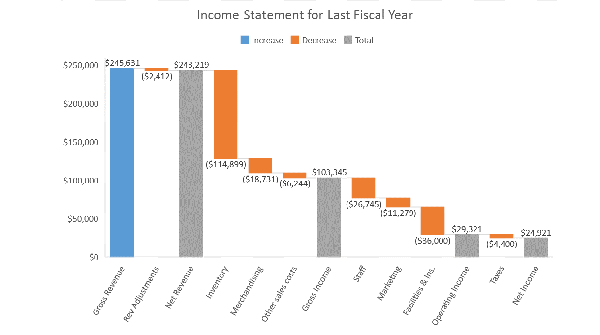
New chart types in Office 2016 Charts are critical for visualizing data, and Office 2016 promises you three news to look at your information. Microsoft promises that they are “particularly good for visualizing financial or hierarchal information and for revealing statistical properties in your data.” Financial: Waterfall Statistical: Histogram, Pareto, Box and Whisker Hierarchical: Treemap… Keep Reading
