 New chart types in Office 2016
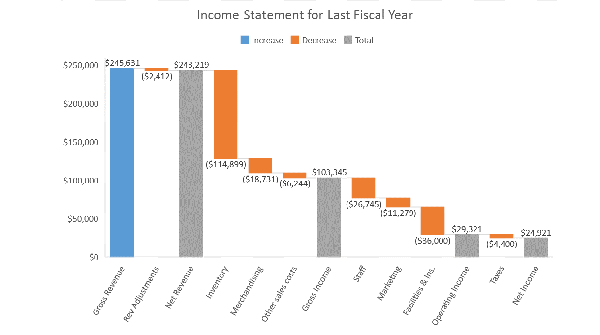
Charts are critical for visualizing data, and Office 2016 promises you three news to look at your information. Microsoft promises that they are “particularly good for visualizing financial or hierarchal information and for revealing statistical properties in your data.”
- Financial: Waterfall
- Statistical: Histogram, Pareto, Box and Whisker
- Hierarchical: Treemap and Sunburst
Excel + Visio = Dashboard!
Dashboards are one of the new “it” words in IT. (Get it?) Coming soon in Office 2016 you’ll be able to link a Visio diagram with an Excel workbook and create a dynamic dashboard.
Complicated field lists for pivot tables and pivot charts become searchable
When you’re dealing with huge data sets, the “simple” task of creating a Pivot Table or Pivot Chart can be daunting. Starting soon you’ll have an extra help when the Excel Field List will add search features so you don’t have to scroll as much.
Full Power Query in Excel right out of the box
Those of you who have been using Excel as a database probably know about Microsoft Power Query for Excel, which was a separate downloadable add-in for Excel 2013 and 2010. This feature will be built-in to the new Office 2016, “with an intuitive and consistent experience for discovering, combining, and refining data across a wide variety of sources including relational, structured and semi-structured, OData, Web, Hadoop, Azure Marketplace, and more.”
Using Excel to tell the future
Business analysts spend a lot of time working in Microsoft Excel to create models to forecast the future. Excel 2016 promise to deliver with three new forecasting functions: Forecast.ETS(), Forecast.ETS.Confint(), and Forecast.ETS.Seasonality(). Now if they could just create a function that will forecast the lottery numbers.
Using your fingers
The increased popularity of touch devices led Microsoft to add the ability to select more than one item in an Excel Slicer using just your fingers.
Data relationships get a new feature
If you’re using a 3-D data structure in Excel, and want to create pivot tables, then the data model is your friend. In Office 2016 we’re offered the sweet option of having Excel inspect the data for automatic relationships. Just point and click your way to BI stardom!
Expanding your Business Intelligence
New features in Office 2016 promise to make it easier to see and use the full suite of BI features. If you’re using one of them (Power View, Power Pivot or Power Map), the rest will be turned on automatically. You can also turn them all on at one time by going File > Options > Advanced > Turn on data analysis features, in Excel.
Image source: Microsoft


